Today we’ll review an open-source testing tool that delivers an excellent developer experience. The k6 performance testing is powerful and flexible for keeping your infrastructure and user experience flawless.
What is k6?
k6.io is a testing tool suitable for performance, load, and stress testing. It has been created with a fierce commitment to contemporary DevOps ideas, and it supports HTTP requests.
If you have basic experience with JavaScript, you can get the tool and implement it instantly. It is remarkable for the easy-to-read output and stunningly-designed documentation.
In short, k6 is:
- Modern;
- Flexible;
- User-friendly;
- With CI/CD in mind.
Core Concepts
What is a test?
It looks much like a unit test but for performance measurement. Performance testing is thought of as a user behavior scenario. You create users, parameters, and metrics and let your test go. In the end, you get the report to analyze and make decisions based on your satisfaction with them from both technical and business perspectives.
A test can be as simple as this:
// script.js
import { sleep } from "k6";
import http from "k6/http";

export default function() {
 http.get("https://fivejars.com/");
 sleep(1);
}
What are Virtual Users (VUs)?
Virtual Users (VUs) is one of the key concepts here. It emulates the behavior of real users, which means when you launch your test, VUs will do everything as though they are the real visitors of your website.
You can have as many VUs as you need. Once the test is launched, VUs start making requests concurrently until the end of the testing procedure.
If we take a look at the simple test above, we can imagine that one VU goes to fivejars.com, downloads an HTML page, all sets, JavaScript, images, CSS, etc. Going to a single website looks like just one request, but in reality, it is a long chain of requests to different components of the page.
You may need to create VUs to check the load of the website and its performance in various circumstances, such as when you make changes to the website or when you get an unexpectedly huge volume of traffic. It will let you know whether your app can bear this or not.
To decide how many VUs you need in your situation, consider using the formula below:

Let’s say that an app receives 10 000 users per hour, and an average session duration equals 10 seconds. It means we will need 27 VUs for the test.
Again, the figures may change depending on the case. They will be different for the regular hours and rush hours. For the stress test, you may have an x10 figure of VUs to check the capability of your app to serve them.
The fundamental takeaways about VUs:
- An entity that executes a test and makes requests;
- Simulate an actual user session;
- They run concurrently and keep repeating the test until the test is over;
- When testing anything “User journey” related, web apps, websites, or API endpoints in a specific order, you should think in terms of Virtual Users.
Types of tests
Baseline
A Baseline test is the simplest one launched locally at the desktop to check the changes in a system’s behavior. It is not resource-intensive and doesn’t need much memory or advanced hardware.
In the example below, we test a system for 12 minutes.
First, we give 1 minute to grow the number of VUs from 0 to 10.
Second, we keep the load unchanged for 10 minutes.
Finally, we reduce the load gradually to 0.
export let options = {
 stages: [
   { duration: '1m', target: 10 },
   { duration: '10m', target: 10 },
   { duration: '1m', target: 0 }
 ]
};
These VUs will run through our scenario as many times as they can before the time is up.
You can pick any limitation. For another test, you would use the number of iterations instead of duration.
Load
The testing of the real load hardly differs. Here we put 2000 as the target value, and this number is quite realistic for complex systems.
export let options = {
 stages: [
   { duration: '5m', target: 2000 },
   { duration: '15m', target: 2000 },
   { duration: '5m', target: 0 }
 ]
};
Spike
As for the Spike testing, we raise the target even higher.
export let options = {
 stages: [
   { duration: '1m', target: 2000 },
   { duration: '9m', target: 2000 },
   { duration: '3m', target: 10000 },
   { duration: '7m', target: 10000 },
   { duration: '5m', target: 0 }
 ]
};
A smooth rise in the number of VUs perfectly reflects the real user behavior. In actual life, the website load is unlikely to see an explosive growth in traffic. Besides, if you make changes to your website capacity (such as extending the backend), you need to notify your system about this and give it a chance to adjust to the new demands.
Metrics
At the end of the day, when we launch a test, we do this for the metrics. We want to know if the current performance of the system satisfies our needs.
Such questions as “Does the API response time take not more than 100 milliseconds?” will be answered after you expose your system to the performance test. As well as you can reveal specific parameters for each page.
Standard metrics
By default, k6 gives you HTTP-related metrics: data volumes, and request time details. It shows you an overview of which components of the system may be too slow or low-performing.
It also shows the test parameters and an overall number of iterations, or a number of tests accomplished by one VU.
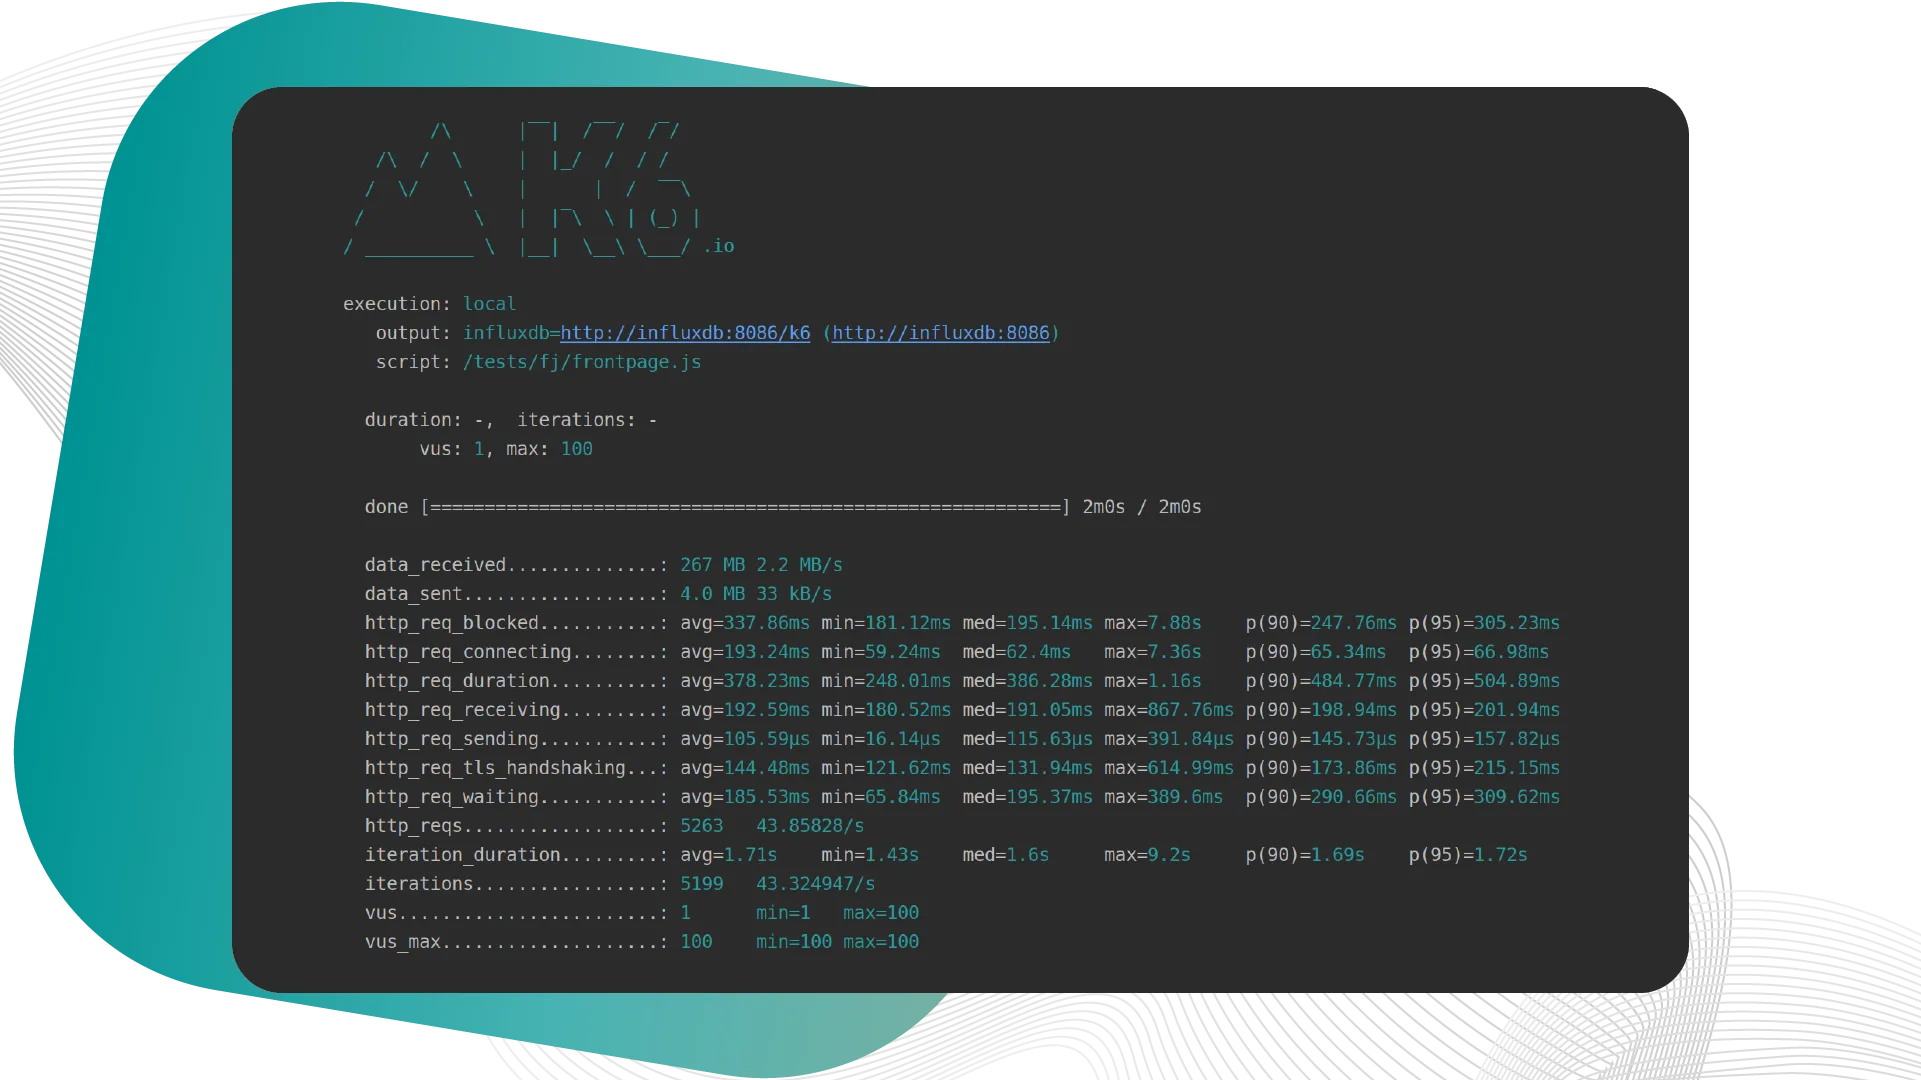
Check out the documentation to look up more in-build metrics.
Custom metrics
Custom metrics set us free to implement anything on our own. Let’s say you need to check all pages to have "DIGITAL TRANSFORMATION!" text in their h1s.
If there is no such occurrence, the request fails, and the website doesn’t work as expected.
To implement this scenario, k6 offers a range of metrics. In our case, we pick a Counter.
- Import Counter from the metrics;
- Create a new object;
- Make a request;
- Check, if there is a text in the headline;
- If there is no text, add 1 to Counter.
import { Counter } from "k6/metrics";
import http from "k6/http";

let counterErrors = new Counter("Errors");

export default function() {
 let res = http.get("https://fivejars.com/");
 let contentOk = res.html("h1").text().includes("DIGITAL TRANSFORMATION!");

 if (!contentOk) {
   counterErrors.add(1);
 }
}
For convenience, we named the object “Errors” and the final report will show us the number of errors caught. See, we had just one request, which turned out to be an error!

import { Counter } from "k6/metrics";
import http from "k6/http";

let counterErrors = new Counter("Errors");

export default function() {
 let res = http.get("https://fivejars.com/");
 let contentOk = res.html("h1").text().includes("DIGITAL TRANSFORMATION!");

 if (!contentOk) {
   counterErrors.add(1);
 }
}
Metric Types
Counter metrics
You are already familiar with the counter. It is a metric that cumulatively sums added values.
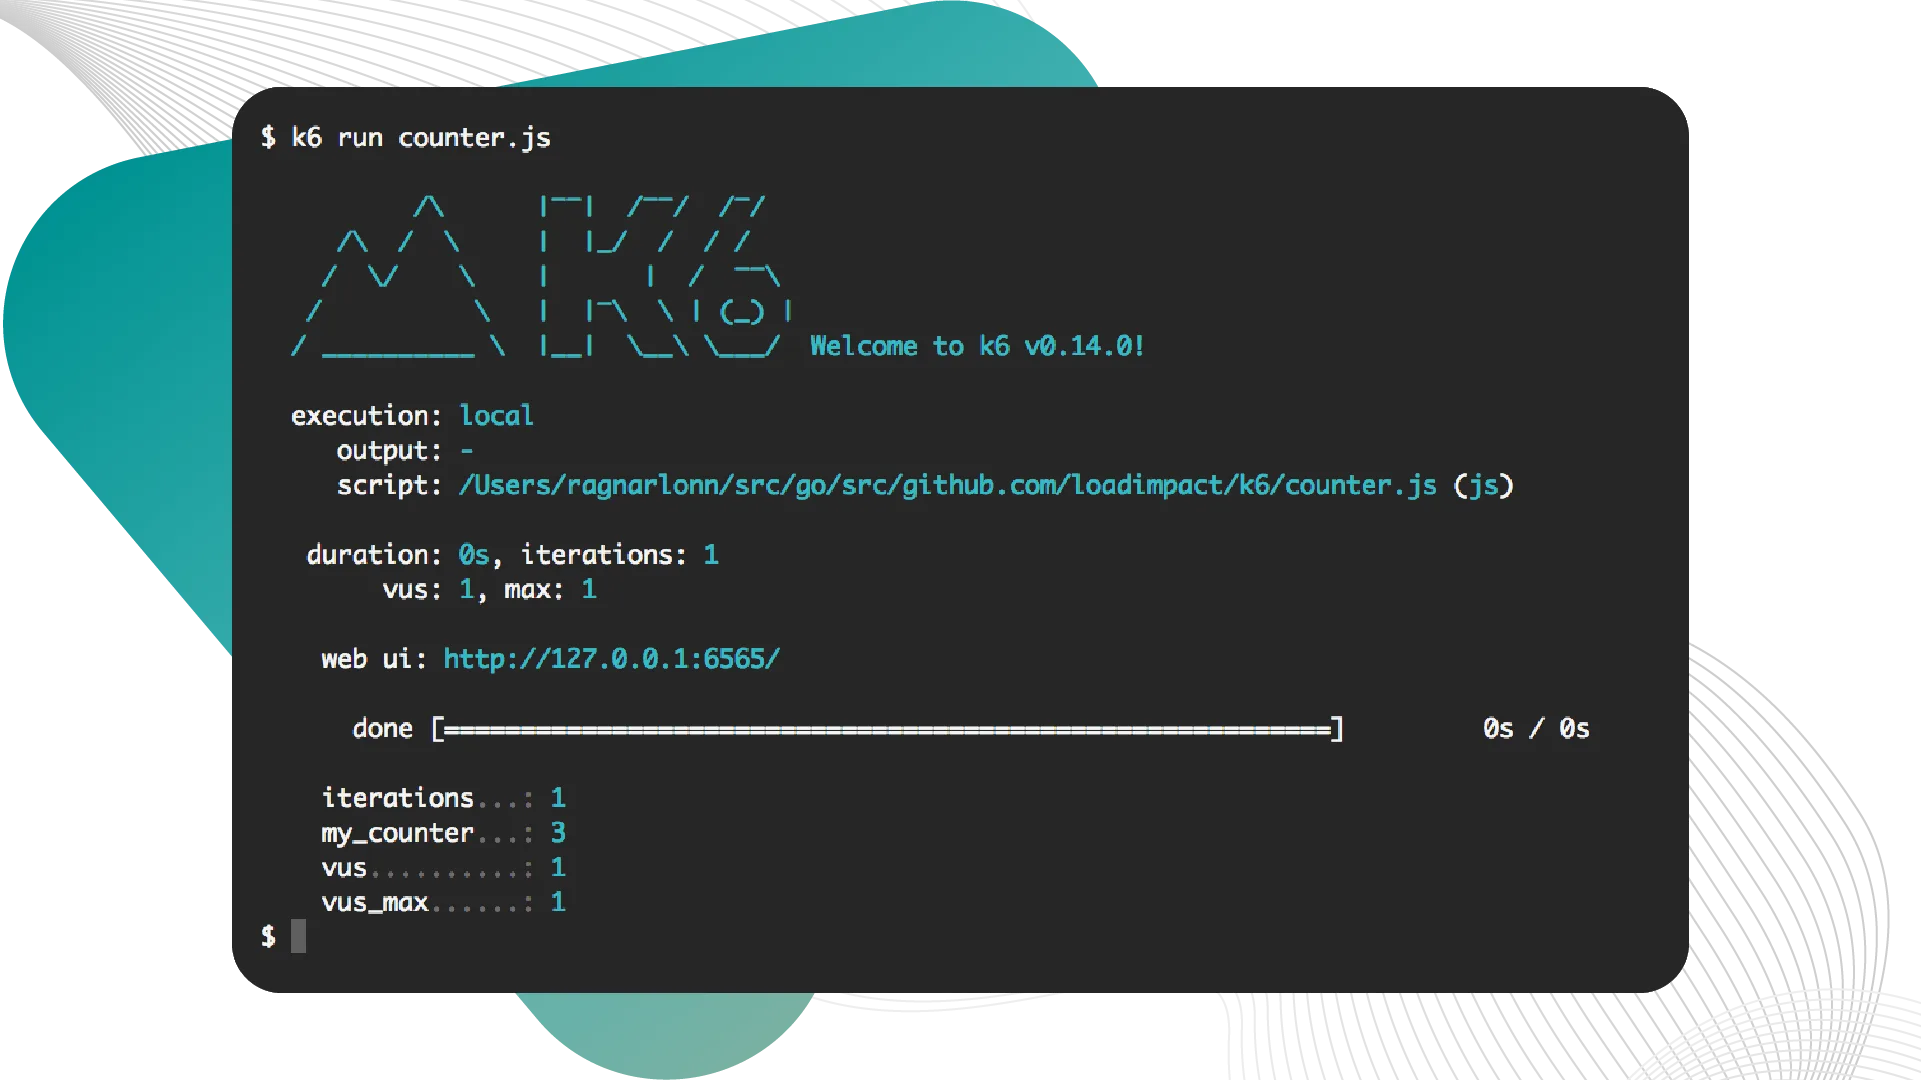
import { Counter } from "k6/metrics";

var myCounter = new Counter("my_counter");

export default function() {
 myCounter.add(1);
 myCounter.add(2);
};
Gauge metrics
They can be viewed as the speedometer. Gauge metrics store the last value added to it. Try to come up with your ideas on how they can be helpful for your tasks.
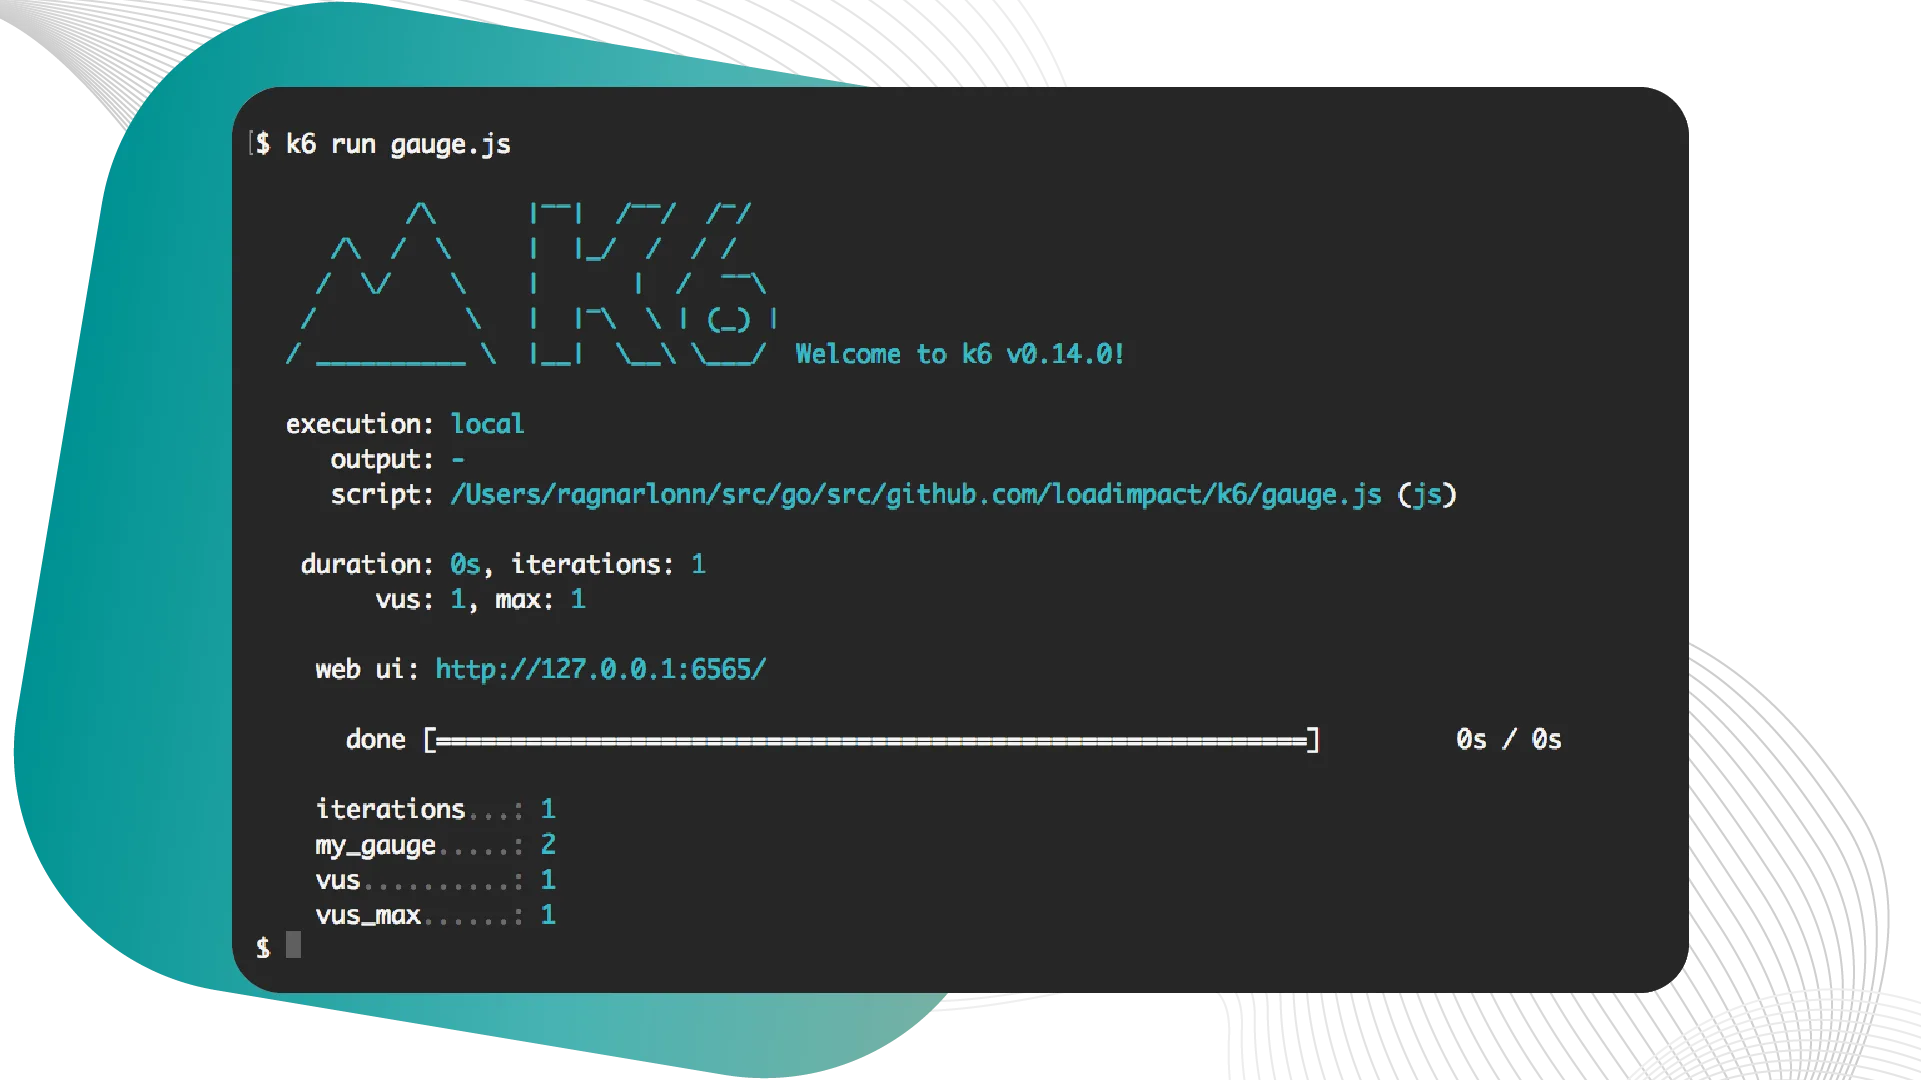
import { Gauge } from "k6/metrics";

var myGauge = new Gauge("my_gauge");

export default function() {
 myGauge.add(3);
 myGauge.add(1);
 myGauge.add(2);
};
Rate metrics
They track the percentage of added values that are non-zero.
To calculate what share of system responses has an OK status, we use this rate metric and add 1 each time when the status is not OK.
In the example, we sent 0 and 1, which is why the share of the non-zero values is 50%.
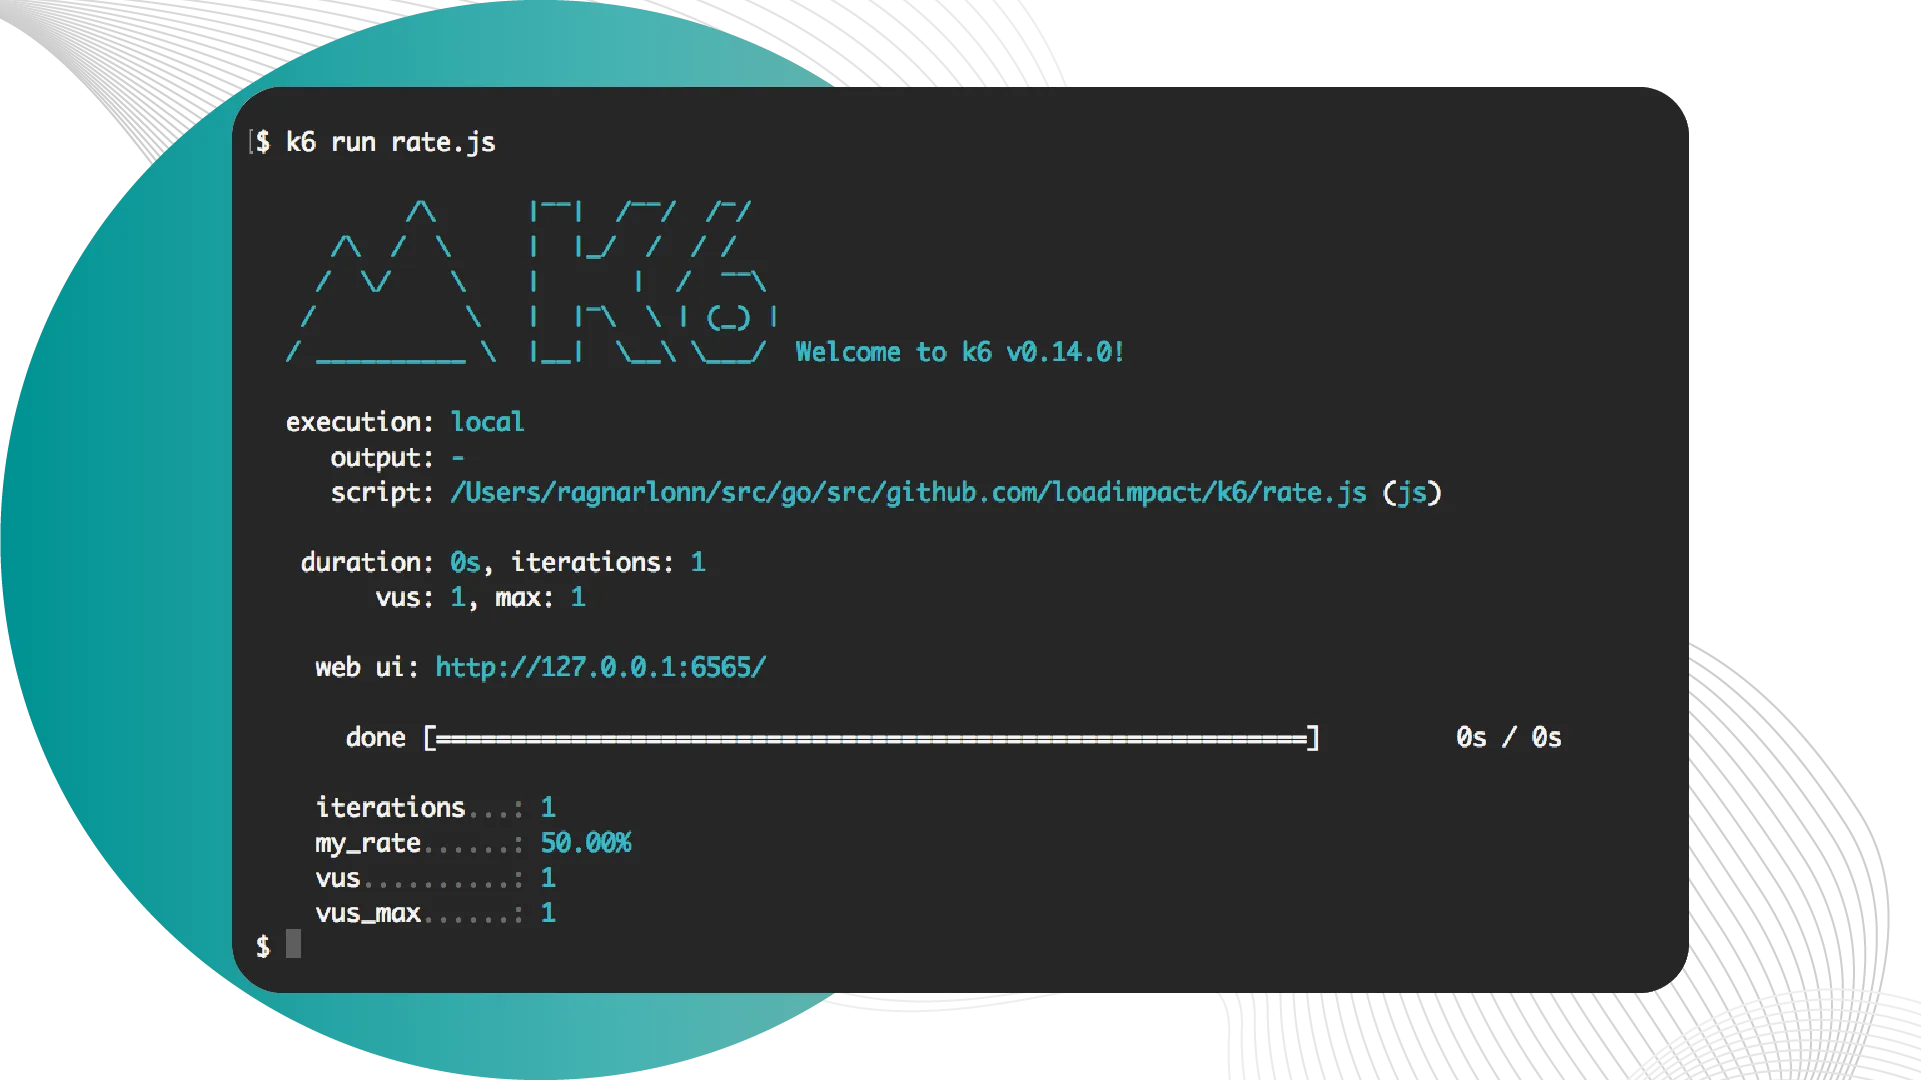
import { Rate } from "k6/metrics";

var myRate = new Rate("my_rate");

export default function() {
 myRate.add(0);
 myRate.add(1);
};
Trend metrics
Trend metrics allow the calculation of statistics on the added values (min, max, average, and percentiles).
By default, it shows the 90th and 95th percentiles.
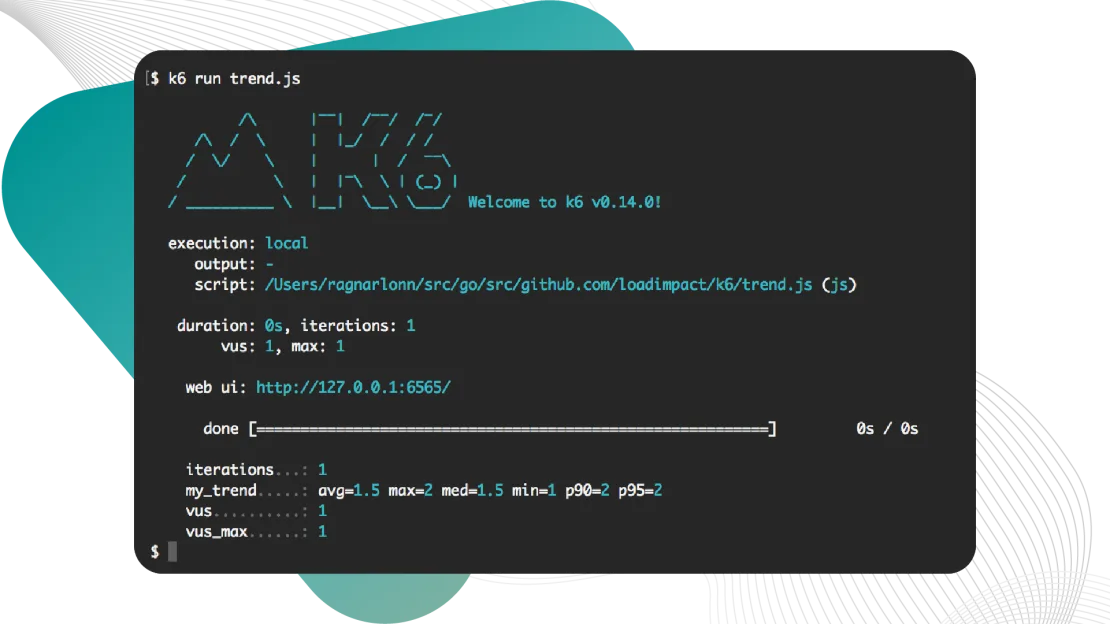
import { Trend } from "k6/metrics";

var myTrend = new Trend("my_trend");

export default function() {
 myTrend.add(1);
 myTrend.add(2);
};
Checks and Thresholds
Checks and thresholds are the basic tools of k6.
Checks are like asserts but differ in that they don't halt execution. It is similar to the check operator, though it doesn’t fail the test like in the classical unit test.
Thresholds are global pass/fail criteria, which you can configure k6 to use. They don’t fail during the testing procedure but they can fail the entire test at the end.
Imagine we state a condition “this API load of the system will give a predicted value in 90% of cases, and a share of errors will be no more than 10%”. We can put this threshold in a test and denote that there will be more than 10% of errors. In this case, the script will return a null response.
It is exactly what k6 was created for - to be able to integrate it into the pipelines, DevOps, etc.
Example
Let’s start a check to see if the website returns a 200 status.
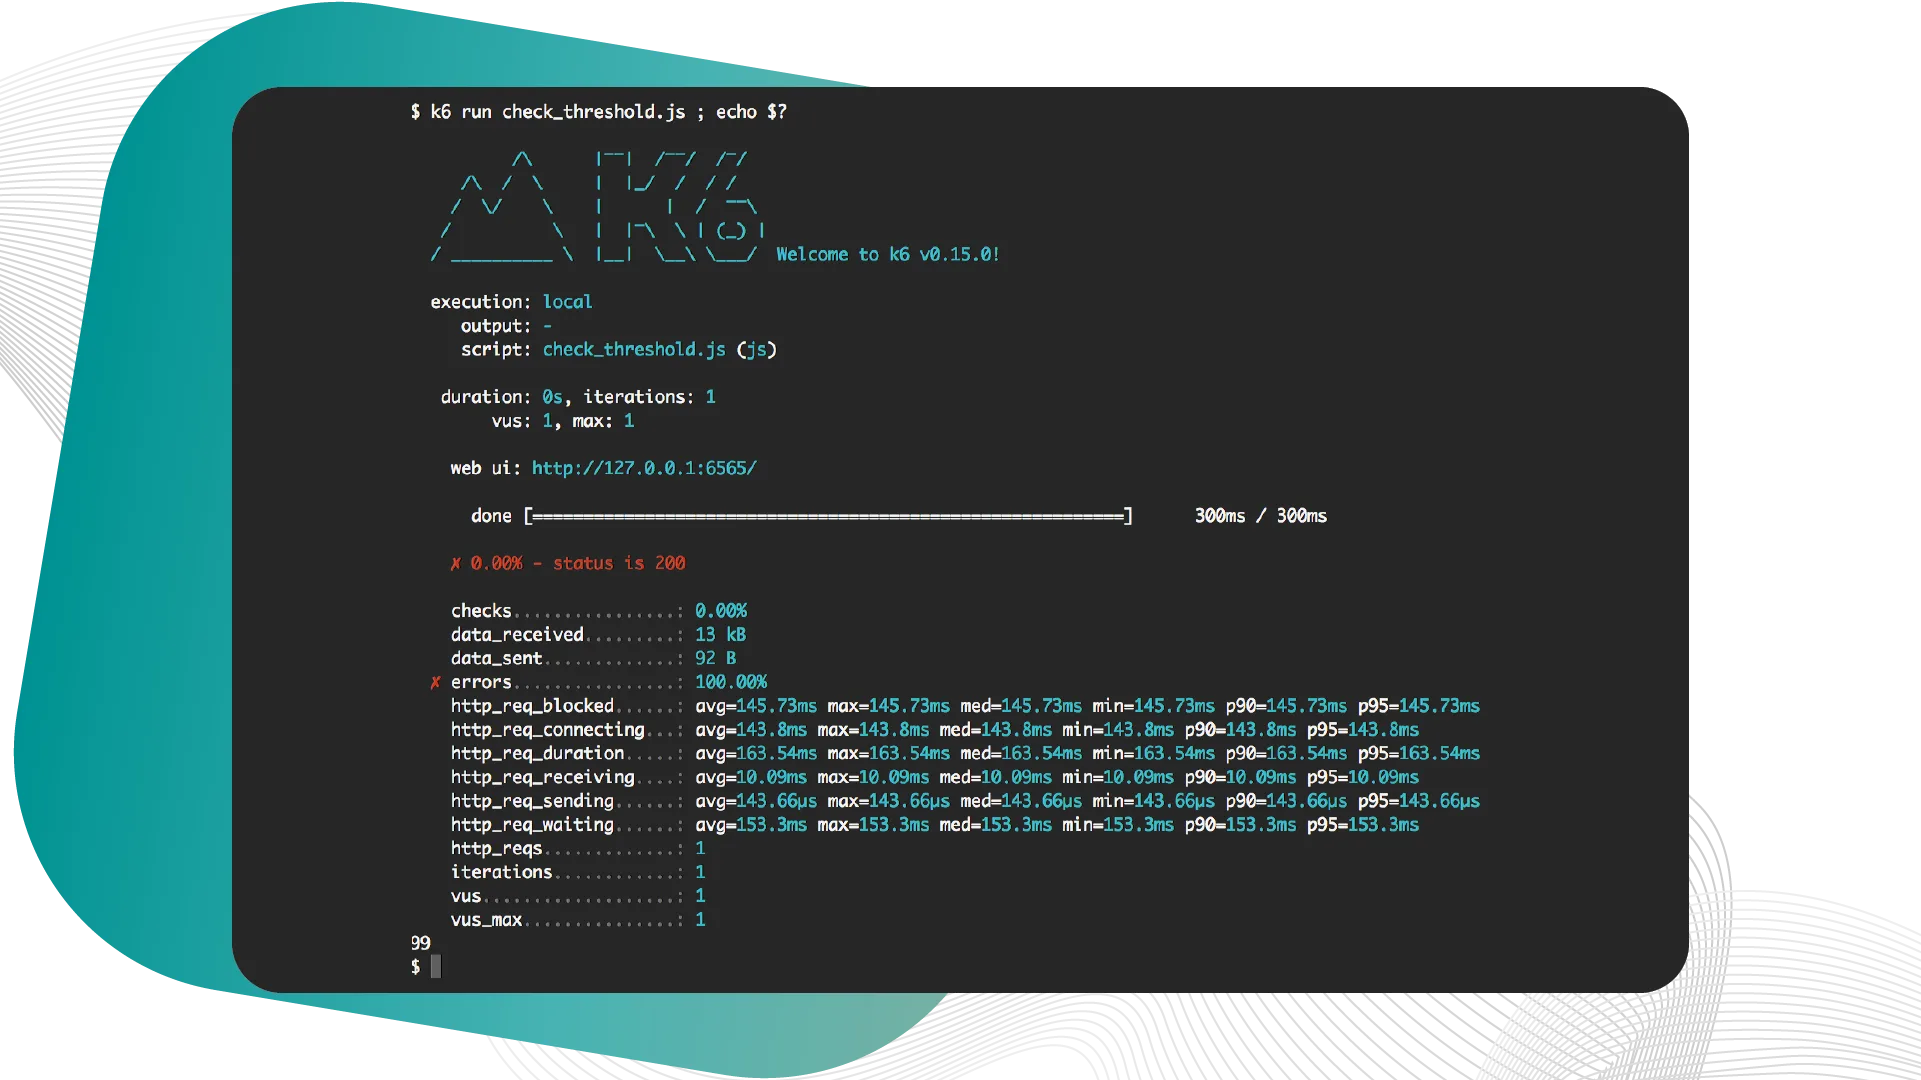
Here we see that the value for the metric is 0%. This check is informative. It won’t fail our test as it only provides us with the statistics to analyze.
But later, we check our custom rate metric, which adds 1 whenever the check fails.
This time we have the value of 100%.
In the options section, we declared a threshold of 10% for this metric, which is why the test failed, and a null code was returned.
import http from "k6/http";
import { check } from "k6";
import { Rate } from "k6/metrics";

export let errorRate = new Rate("errors");

export let options = {
 thresholds: {
   "errors": ["rate<0.1"], // <10% errors
 }
};

export default function() {
 check(http.get("http://fakesite.com"), {
   "status is 200": (r) => r.status == 200
 }) || errorRate.add(1);
};
Anatomy of a Test
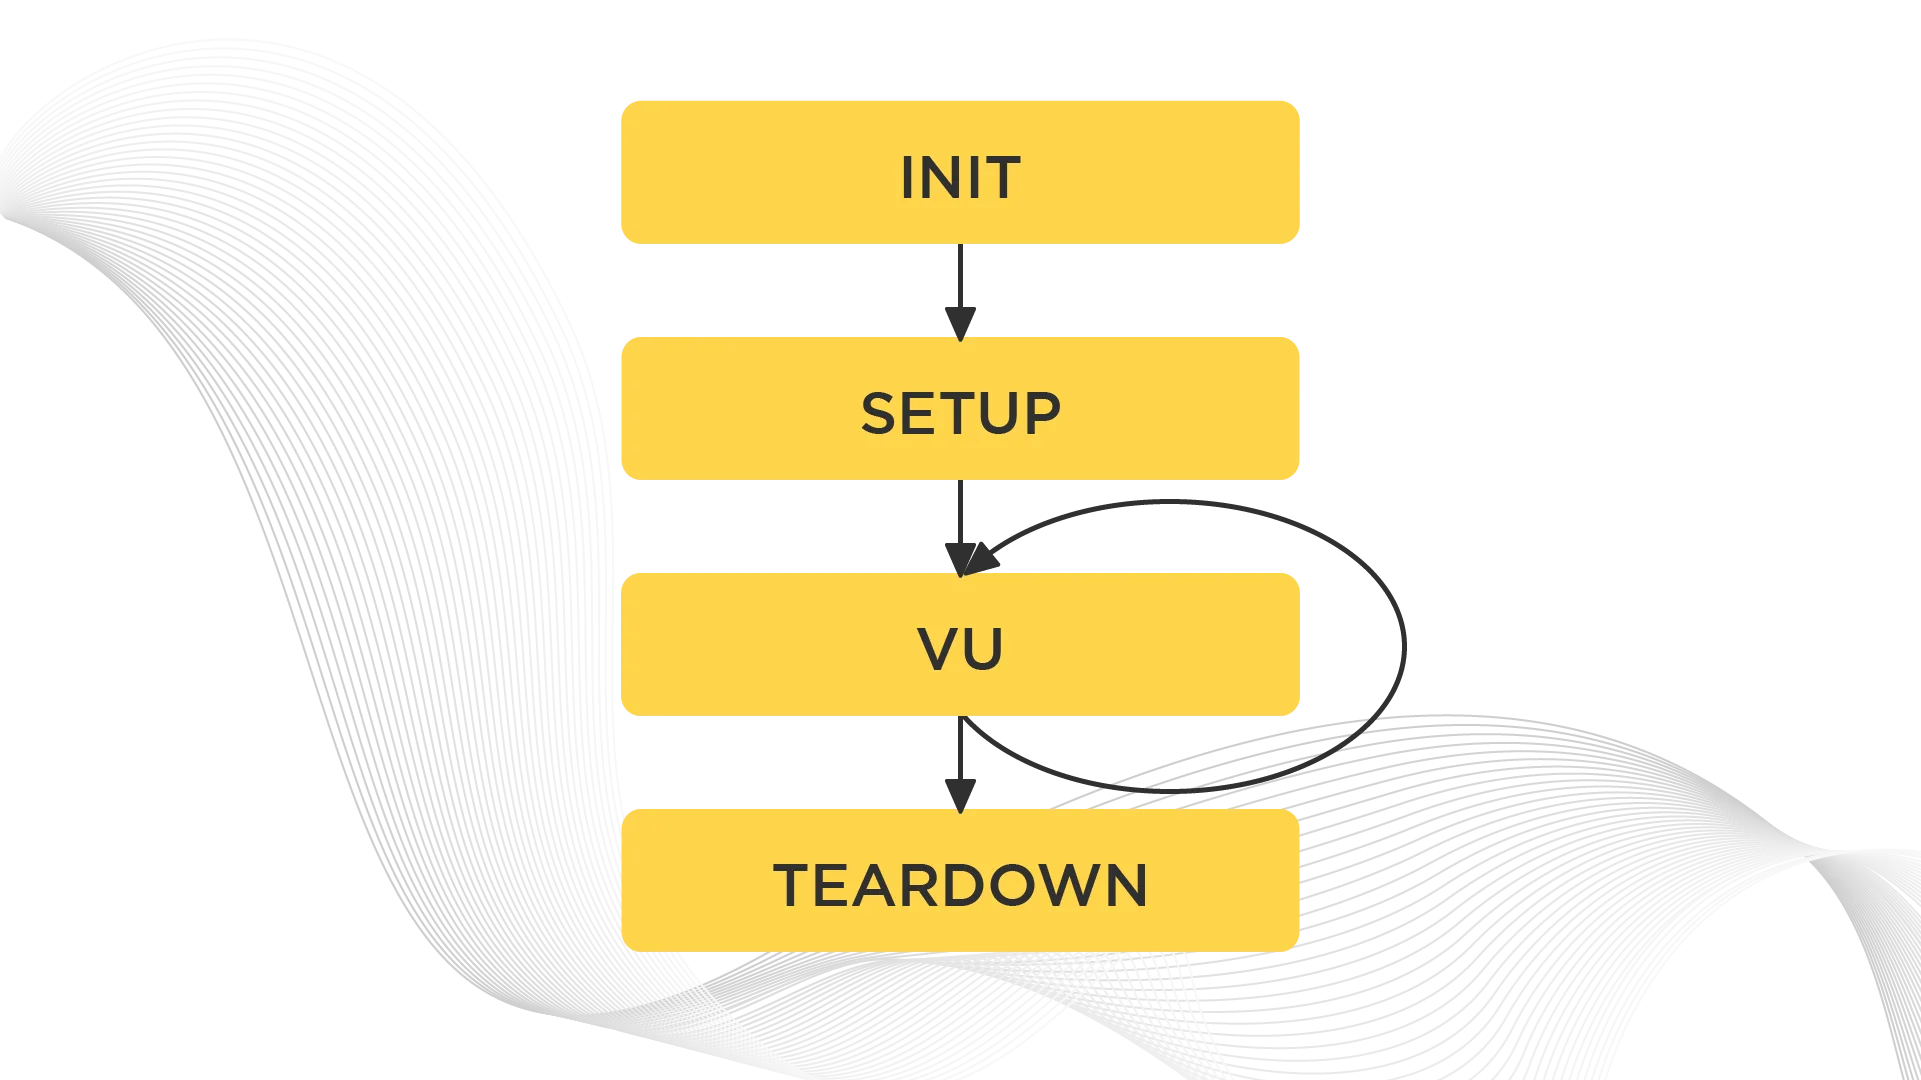
In the essence the test contains 4 stages:
- Initialization, which includes import, variables, custom metrics, and their declaration, and options setup;
- Setup (optional). It is executed 1 time per VU. Imagine you need to test a system with a login feature. For this case, you’ll need to ensure registration for each new VU before the test.
- VU (main section). It is where the test code lives for your VUs. In the main section you usually put the business login for the test. This part of the code is executed as many times as set by the test conditions.
- Teardown. In the final stage, we clear everything up. Such as, you will definitely wish to delete all the newly-registered VUs.
// Init code, imports and setup counters etc.

// Optional.
export const options = {
  // ...
}

// Optional.
export function setup() {
  // Setup code
}

export default function(data) {
  // VU code.
}

// Optional.
export function teardown(data) {
  // Teardown code.
}
Writing and Running Tests
So, how exactly to write and launch a test? We have a couple of examples. First, let’s take a simple one, where we will request a fivejars.com page.
You have three ways to launch a k6 test:
- download a k6 package for your platform;
- launch in Docker. The package is pre-installed there;
- launch in the cloud provided by Load Impact.
We will do it in Docker.
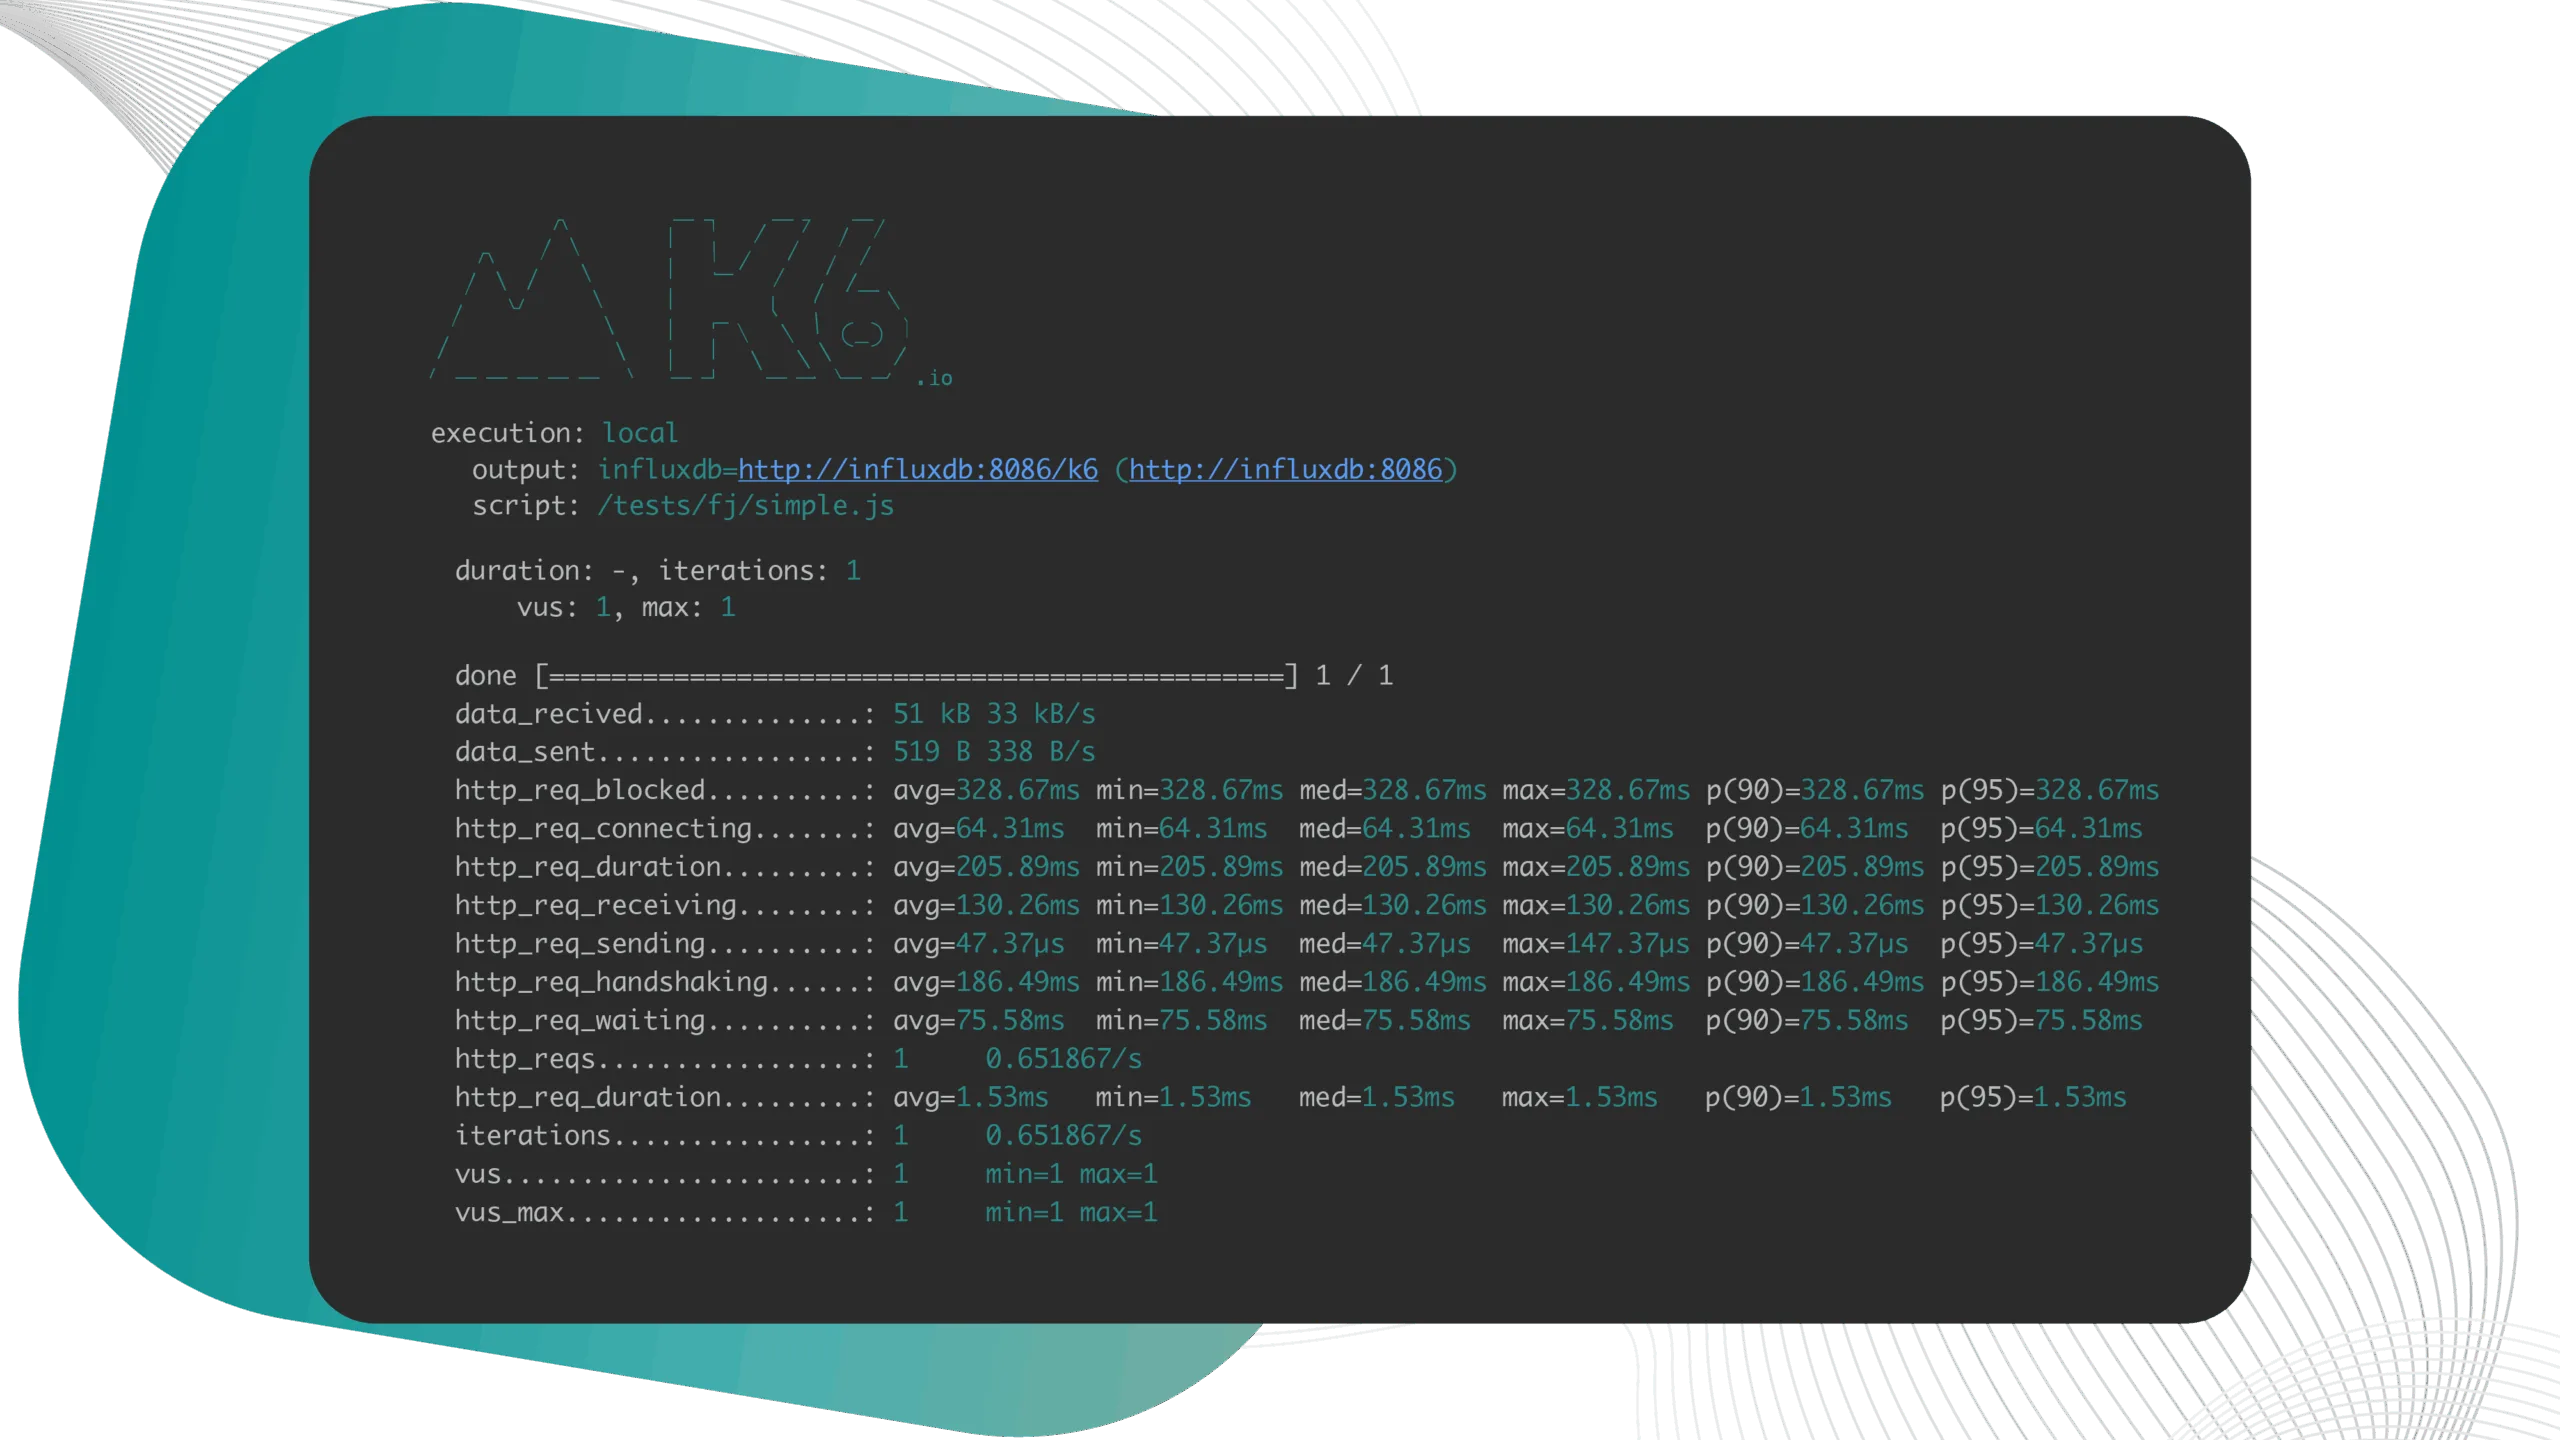
We don’t have options in the script, that’s why the test will be executed once for one VU, and all the information we get is about this particular request.
When we change the number of VUs to 5 and set the duration to 10 it will give us 40 iterations, or 40 requests.
An alternative option is to launch the same test for 12 seconds and let’s hope the website doesn’t crash.
Finally, we could use the cloud command to send the script to the cloud. It would generate us a link to go and enjoy a fancy interface with our test results.
Recording Tests
Writing these tests can get tedious, especially for websites. Luckily, you can use the test recorder extension to simulate load and generate a baseline test. Let’s look at how it works.
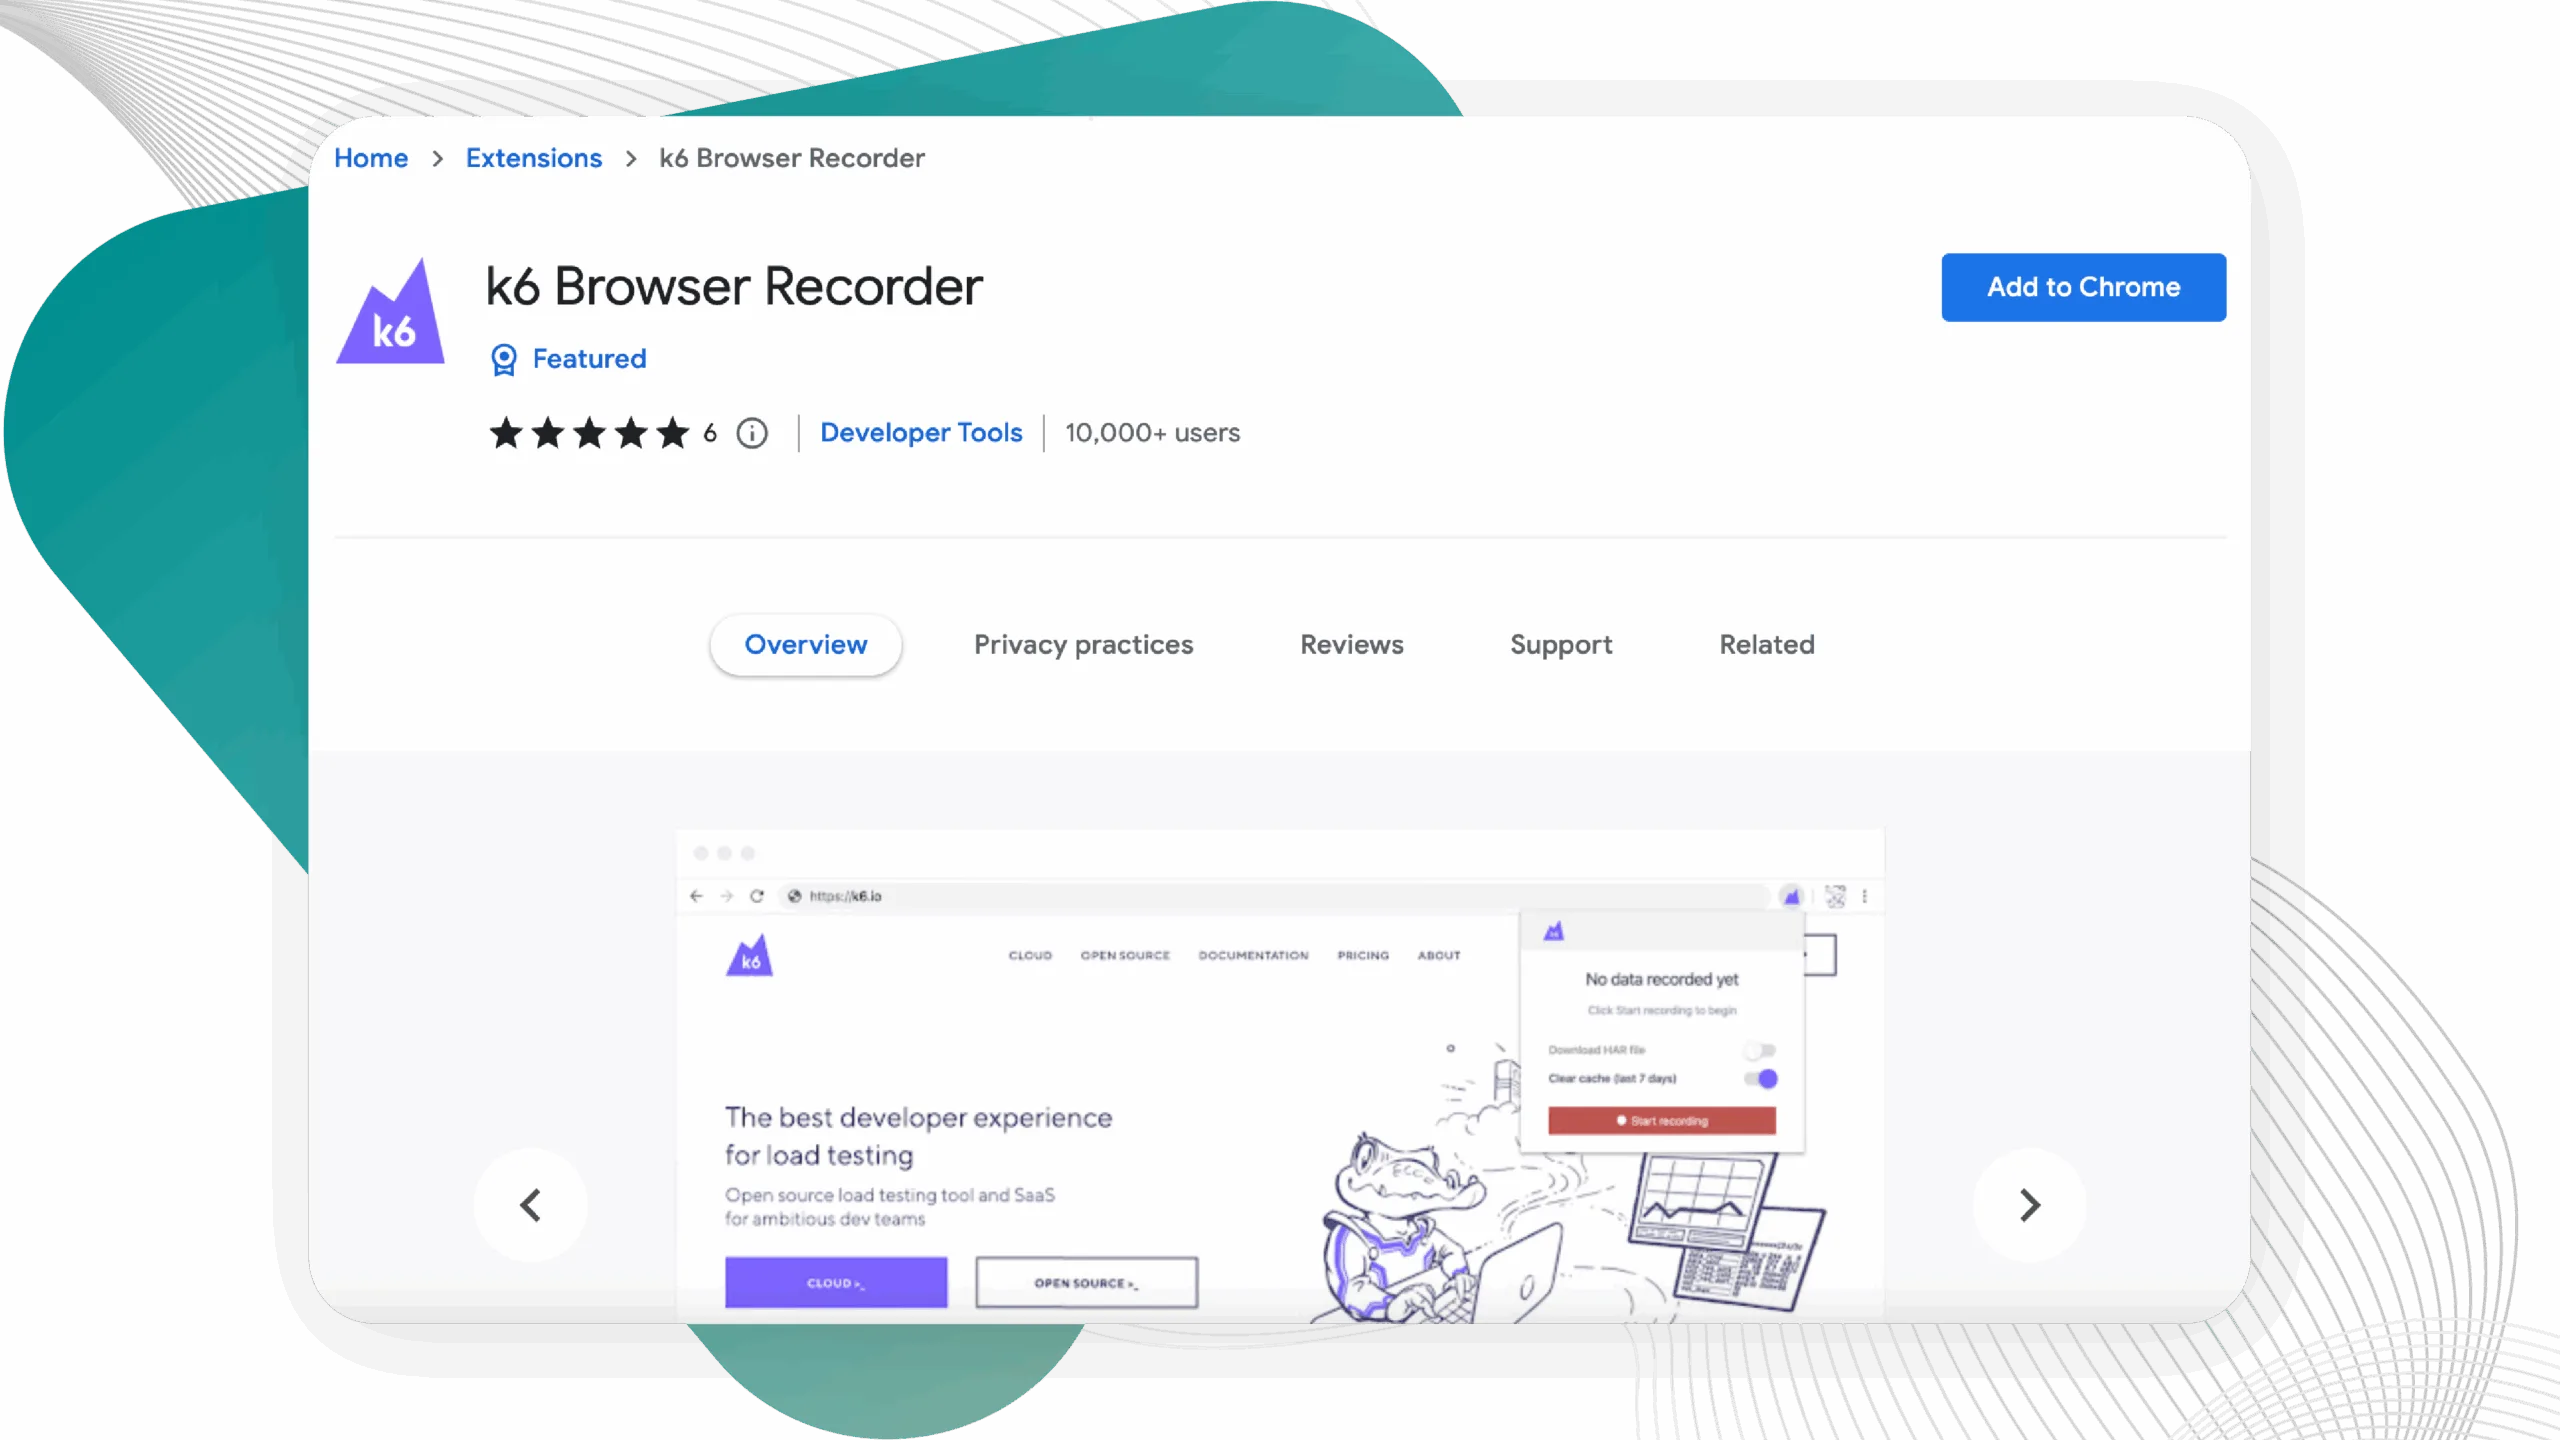
Once you try it, you will know how time-saving it is to build up a basic test with a test recorder. You don’t need to limit yourself to just one page during the recording. Feel free to click through several pages to imitate a real user journey.
The console figures are not the key part of the results output, check out this piece of documentation to learn what more you can do.
k6 allows you to export detailed test results, as well as use numerous plugins to which you can send them:
Currently, there are a few plugins that can output data:
- JSON plugin that writes data in JSON format to a file;
- Plugins that push the metrics to:
- Apache Kafka;
- StatsD;
- Datadog;
- InfluxDB;
- Cloud plugin that streams your test results to the k6 Cloud platform.
As a demo, we will use a pre-setup Grafana monitoring tool. We will view a dashboard and track the changes.
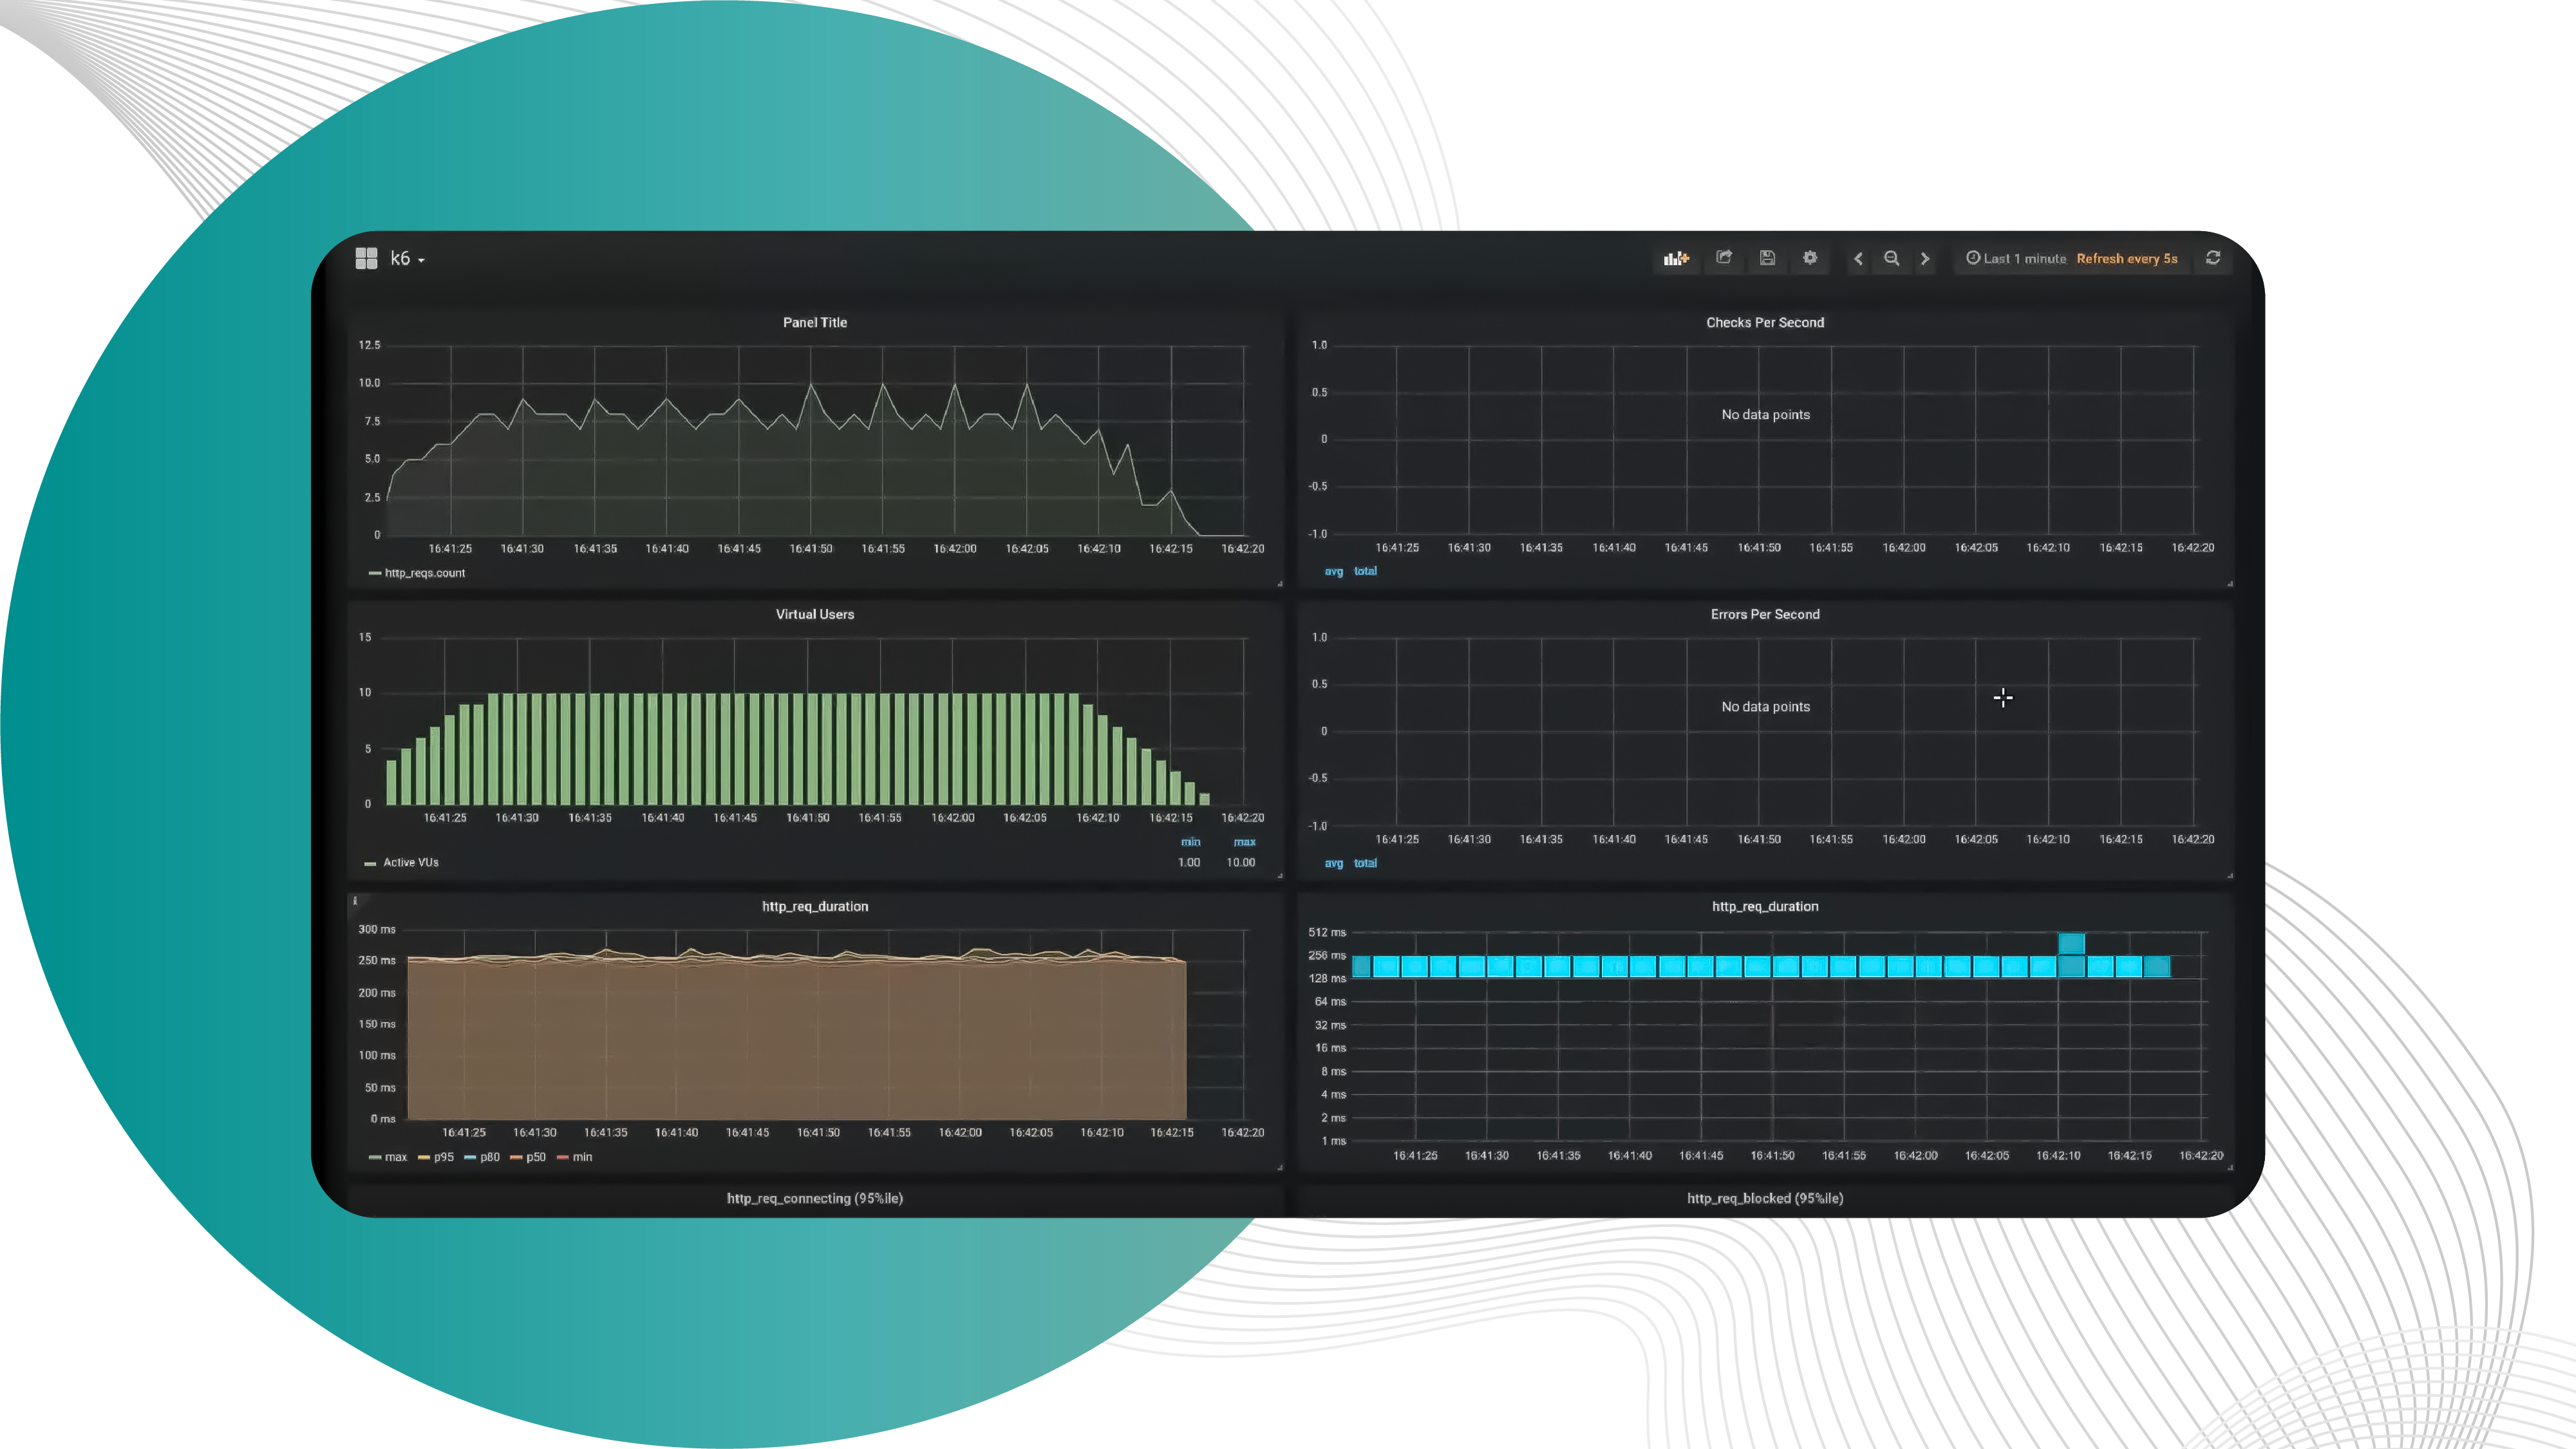
In their GitHub, k6 provides a ready Docker compose configuration and aggregates Grafana and InfluxDB. This panel is super easy to set up. The combo of Grafana and InfluxDB allows you to make up more informative samples.
If you enrich your dashboard with the server metrics, such as processor load or memory usage, you will view the issues at a glance and fix them timely.
Conclusion
k6 is a powerful alternative to Cypress and JMeter. It operates with HTTP requests, but you can also go with it deep down to the data structures.
You can effectively spot vulnerabilities in your system, and track the changes in the hosting infrastructure. With all the information available, you will always know whether you’re reaching your goals or not.
k6 has well-structured documentation designed as a set of guides for tightly specific tasks, which is outstanding work on their side.
Last but not least, k6 lets you integrate with the most frequently used tools. It allows you to migrate with .har files, JMeter, Postman collection and convert it all to the JavaScript code.
